Event targets
Currently two event targets can be configured:
- Notification backend via Kafka topic
- ServiceLog via REST API
Notification backend
Events are sent into the Kafka topic provided by Notification service. Alternatively it is possible to use REST API (or rather REST API Gateway) for applications that reside outside cloud.redhat.com and/or can’t access Kafka topic directly.
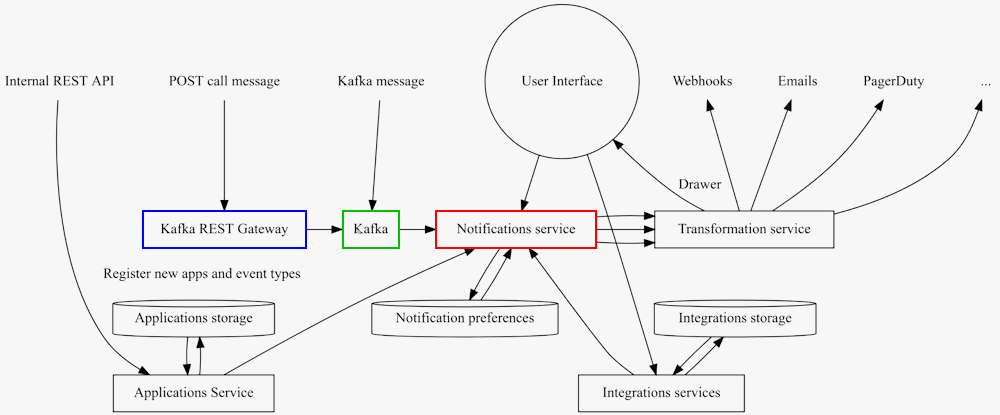
Events are processed by the notification service and after filtering they are sent to the so-called transformation service for further processing.
There the templating is done (the event itself contains basically a set of key+values pairs) and messages are sent to customers/users via pre-defined channels like webhooks, e-mails, Slack (planned for the future etc.)
The event itself is represented as JSON with a set of key-value pairs. These values are then used by template engine (Transformation service) to produce user-readable description, for example a new email.
The event types are the most atomic piece of information handled by the notification service, and it is recommended to keep their number for a given application to the lowest (for ease of use of the application mostly).
The JSON schema for the expected event is currently defined in the
RedHatInsights/insights-schemas-java repository.
Depending on the version specified in the notification event, the template engine
could in theory provide different functionalities. The current default version
is “2.0.0”, which does not bring new changes in the message’s fields, but instead
marks the change of data serialization format from Avro (vx.x.x) to json-schema-validator.
ServiceLog
OCM Service Log or OSL is a micro-service that ingests logs related to specific clusters from various internal services and stores them for internal and external consumption.
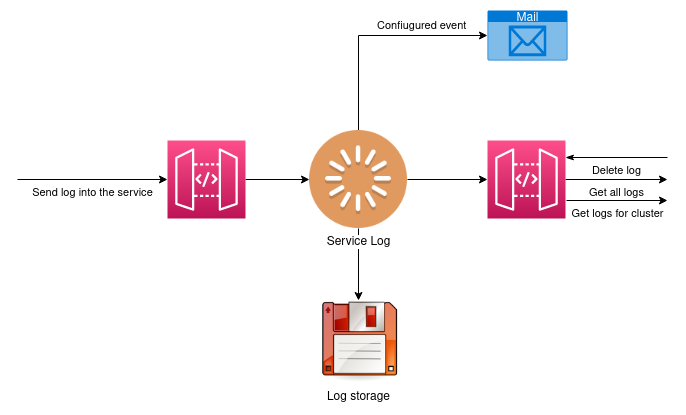
Log entries are created against a particular UUID. Created events are sent to
the /api/service_logs/v1/cluster_logs endpoint using a POST query. Said query
includes JSON object with a summary/title, a description, a timestamp of when
the event occurred, and a severity. This is an example how log entry could look
like:
{
    "severity": "Info",
    "service_name": "Insights",
    "username": "Insights",
    "cluster_uuid": "d484b150-3106-4d6a-96b4-e03c327a2f66",
    "summary": "Subscription created",
    "description": "Following issues have been found…",
    "internal_only": false,
    "timestamp": "2022-07-12T07:08:09Z",
    "event_stream_id":"1gKkRgiC5dCUJ7PxTPbn8J4FjGa"
}
The severity field is set using a 1-1 relationship with the calculated total risk of the processed issues. The equivalence between our severity levels and the service log severity levels is as follows:
Critical - Critical
Important - Major
Moderate - Warning
Low - Info
Formats and styles in description field
The description field of logs supports markdown formatting and it is encouraged to use it.
Log record structure for creating new log record
Schema
{
    href            string
    id              string
    kind            string
    cluster_id      string
    cluster_uuid    string
    Created_at      string($date-time)
    created_by      string
    description     string
    email           string
    event_stream_id string
    first_name      string
    internal_only   boolean
                    default: false
    last_name       string
    service_name    string
    severity        stringEnum:
                    [ Debug, Info, Warning, Error, Fatal ]
    subscription_id string
    summary         string
    Timestamp       string($date-time)
    username        string
}
Example - JSON with all optional fields
{
  "href": "string",
  "id": "string",
  "kind": "string",
  "cluster_id": "string",
  "cluster_uuid": "string",
  "created_at": "2022-07-11T16:44:27.146Z",
  "created_by": "string",
  "description": "string",
  "email": "string",
  "event_stream_id": "string",
  "first_name": "string",
  "internal_only": false,
  "last_name": "string",
  "service_name": "string",
  "severity": "Debug",
  "subscription_id": "string",
  "summary": "string",
  "timestamp": "2022-07-11T16:44:27.146Z",
  "username": "string"
}
Service Log in context of the CCX Notification Service
CCX Notification Service sends JSON entry to Service Log containing the following subset of fields (each entry is associated with a single report):
summaryis set todescriptionof the rendered report received from template renderer responsedescriptionis set toreasonof the rendered report received from template renderer response. It also includes a link to the correspondingrecommendationpage of the Advisor, where more detailed information about the rule can be found.service_nameis set to"CCX Notification Service"for all entries created by this servicecluster_uuidis set to UUID of the cluster related to the report associated with created entry
More information about the template renderer can be found here).