Data flow
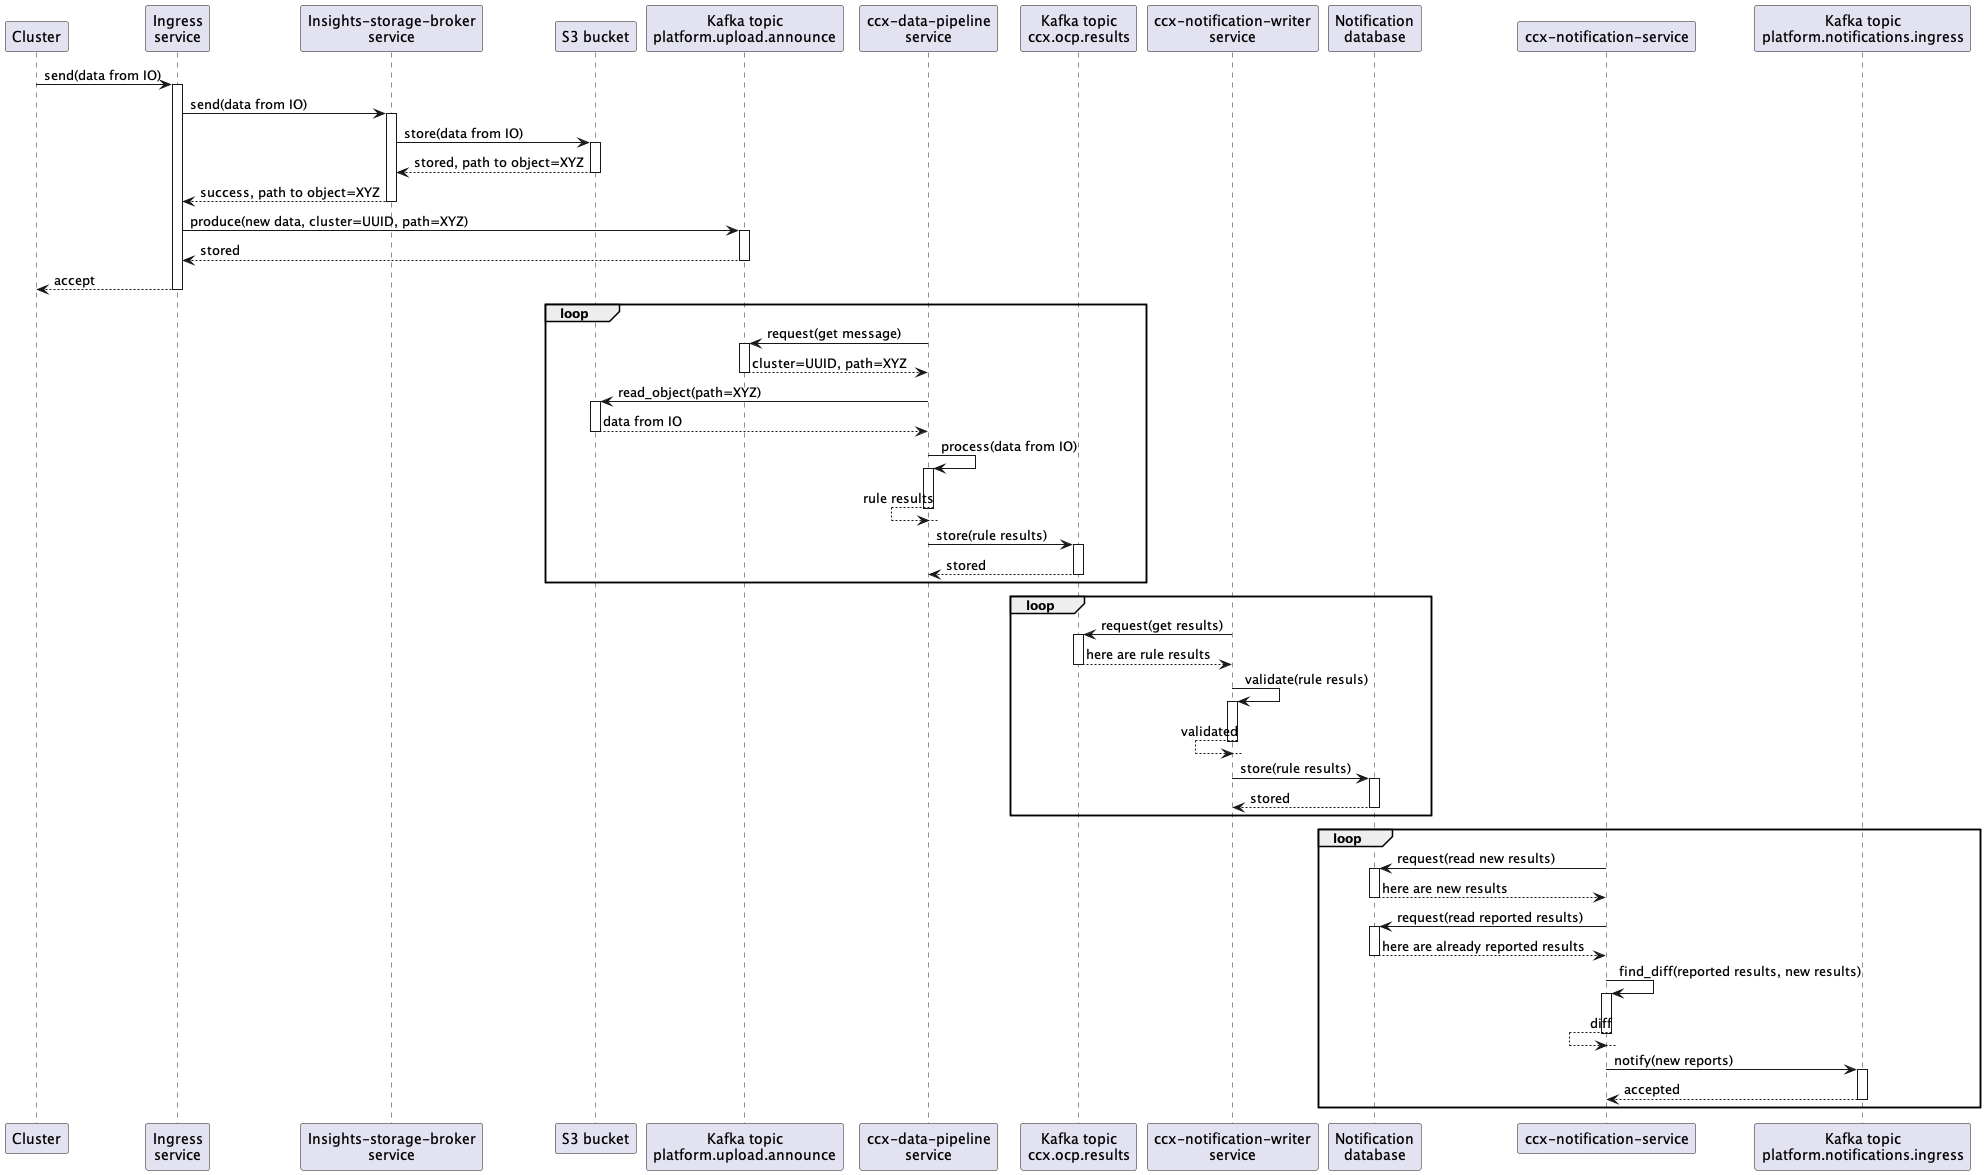
The “end-to-end” data flow is described there (including Notification Writer service part):
- A customer cluster with Insights Operator installed sends new data containing info about the cluster into Ingress service
- The Ingress service consumes the data, writes them into an S3 Bucket, and produces a new message into a Kafka topic named
platform.upload.announce. - The CCX Data pipeline service consumes the message from the
platform.upload.announceKafka topic. - That message represents an event that contains (among other things) an URL to S3 Bucket.
- Insights operator data is read from S3 Bucket and insights rules are applied to that data in
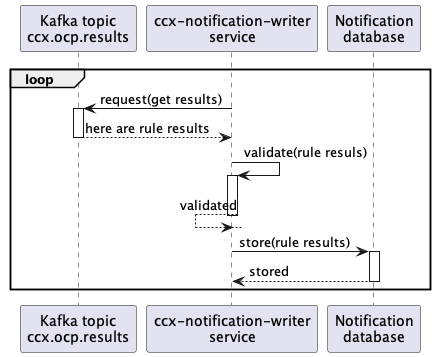
ccx-data-pipelineservice. - Results (basically
organization ID+cluster name+insights results JSON) are stored back into Kafka, but into different topic namedccx.ocp.results. - That results are consumed by
ccx-notification-writerservice. ccx-notification-writerservice stores insights results into AWS RDS database intonew_reportstable.- Content of that table is consumed by
ccx-notification-serviceperiodically. - Newest results from
new_reportstable is compared with results stored inreportedtable. The records used for the comparison depend on the configured cool down time. - If changes (new issues) has been found, notification message is sent into Kafka topic named
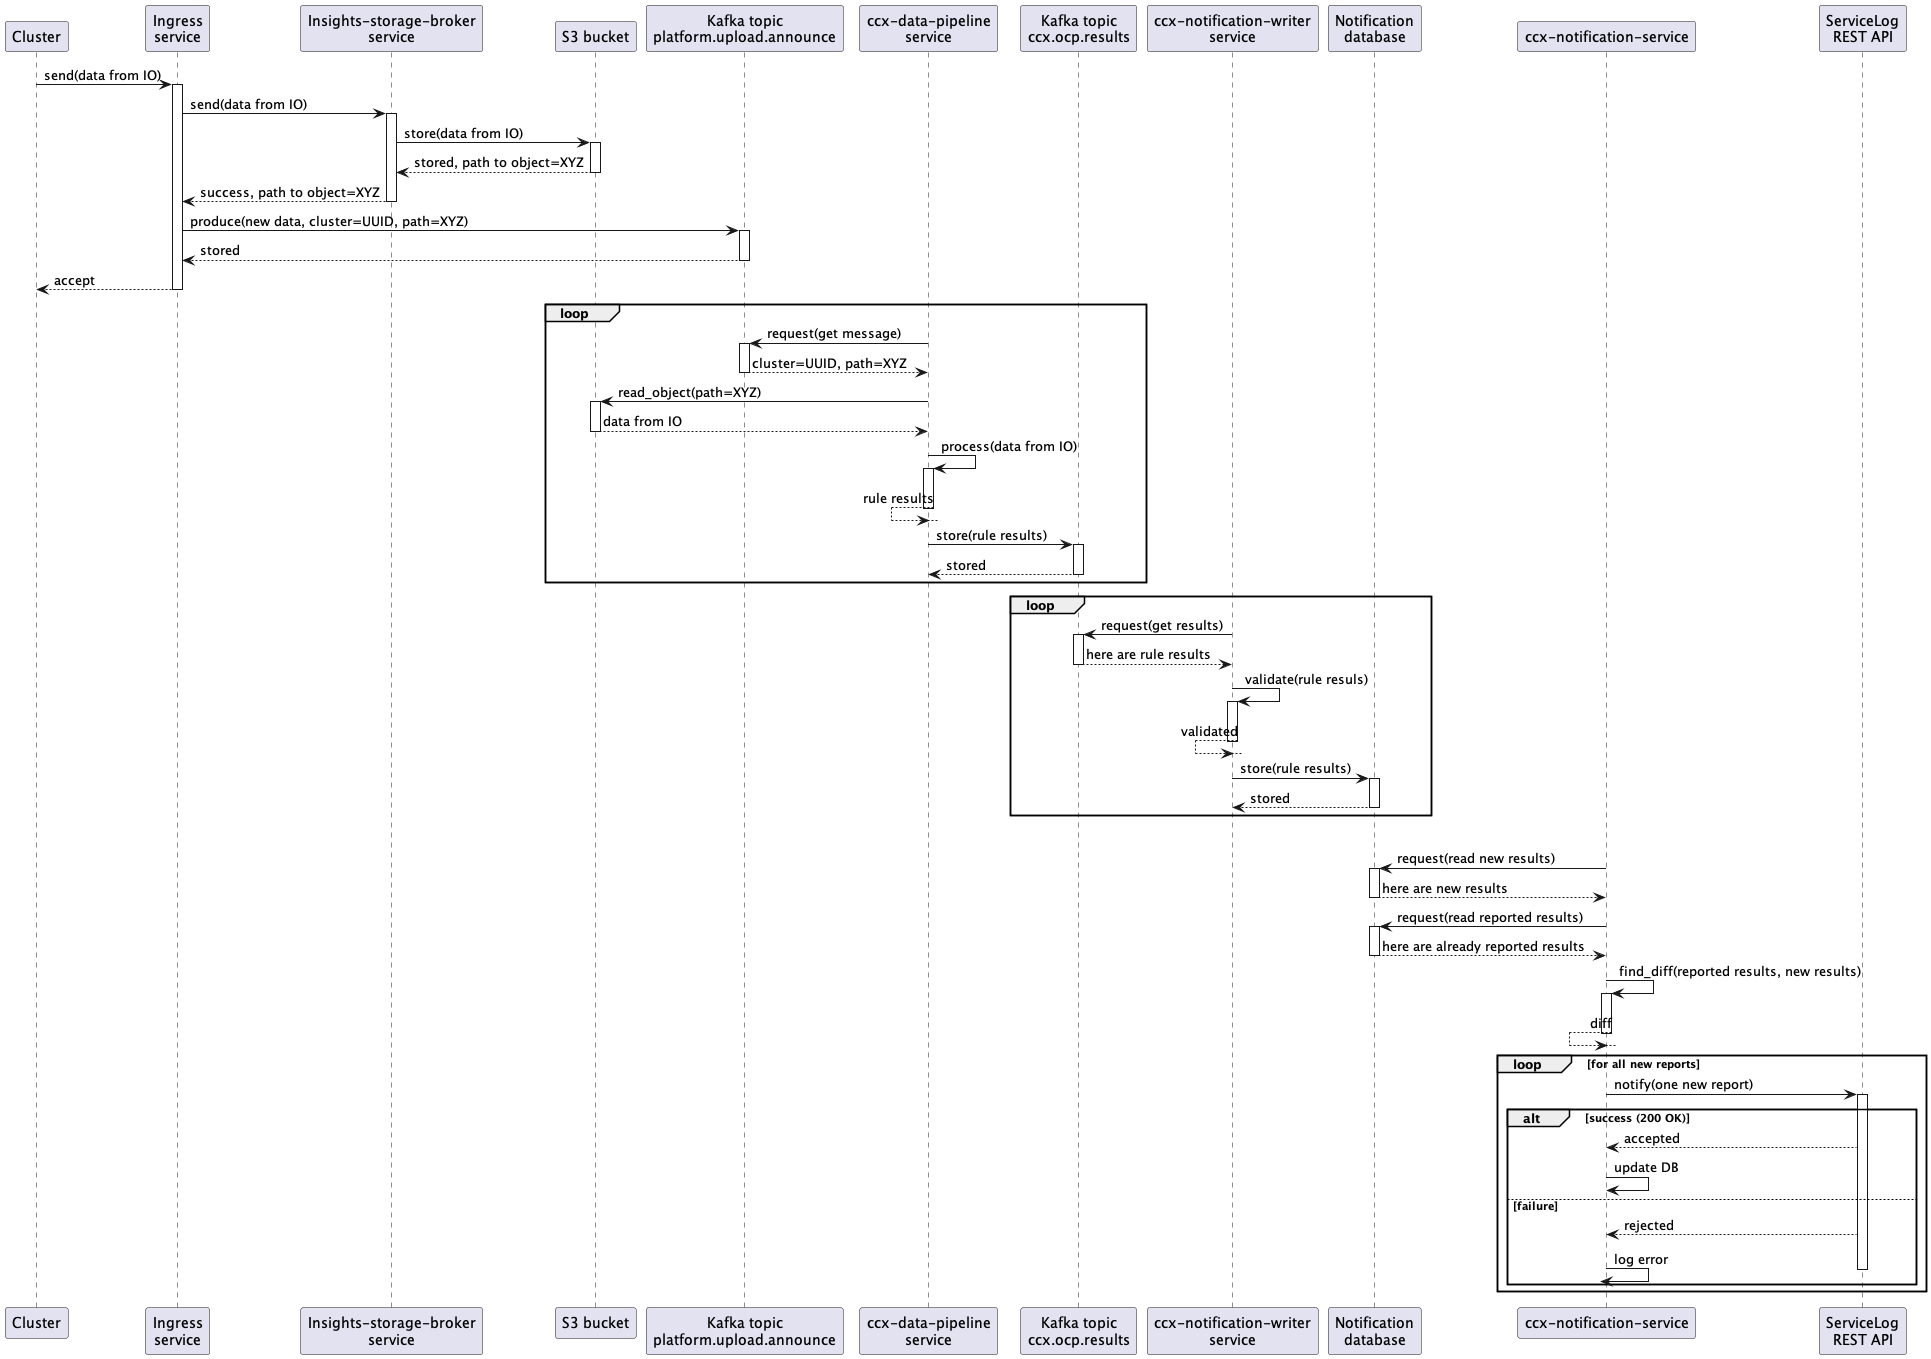
platform.notifications.ingress. The expected format of the message can be found here - New issues are also sent to Service Log via REST API. Because Service Log accepts description and content to be represented in Markdown, issues are “rendered” first by Insights Content Template Renderer. To use the Service Log API, the
ccx-notification-serviceuses the credentials stored in vault. - The newest result is stored into
reportedtable to be used in the nextccx-notification-serviceiteration.
Remarks
- Steps 1 to 5 are shared with the CCX Data pipeline
- Steps 7 and 8 are performed by
ccx-notification-writerservice. - Steps 9 to 13 are performed by
ccx-notification-serviceservice with the help of Insights Content Service and Insights Content Template Renderer.
Cool down mechanism
The cool down mechanism is used to filter the previously reported issues so that they are not continuously sent to the customers. It works by defining a minimum amount of time that must elapse between two notifications. That cool down time is applied to all the issues processed during an iteration.
The value expected in the configuration is a string that respects the format of PostgreSQL’s interval type.
Data flow of the notification service without cool down
See steps 9 to 12 of the data flow section
Data flow of the notification service with cool down
- The latest entry for each distinct cluster in the
new_reportstable is consumed by theccx-notification-service. - Results stored in
reportedtable within the cool down time are retrieved. Therefore all the reported issues that are not older than the configured cool down are cached in apreviouslyReportedmap by the service in each iteration. - When checking for new issues in the report, the
ccx-notification-servicelooks up each issue in thepreviouslyReportedmap, and if found, that issue is considered to still be in cool down and is not processed further. If not found, the processing of the issue continues. - If changes (new issues) has been found between the previous report and the new one, a notification message is sent into Kafka topic named
platform.notifications.ingress. The expected format of the message can be found here. - New issues is also sent to Service Log via REST API. To use the Service Log API, the
ccx-notification-serviceuses the credentials stored in vault. - The newest result is stored into
reportedtable to be used in the nextccx-notification-serviceiteration.
Configuring the cool down mechanism
The cooldown mechanism can be configured by specifying the cooldown field under each integrated service’s configuration.
Currently, the cooldown field can be configured under the kafka_broker and service_log configurations in the config.toml file or by setting the CCX_NOTIFICATION_SERVICE__KAFKA_BROKER__COOLDOWN and CCX_NOTIFICATION_SERVICE__SERVICE_LOG__COOLDOWN environment variables respectively.
The value set is used directly within an SQL query, so the expected format is an integer followed by a valid SQL epoch time units (year[s] month[s] week[s] day[s] hour[s] minute[s] second[s])
As of today, since we only keep 8 days of data in our database, the maximum cooldown that can be applied is 8 days.
In case new services are supported in the future, the corresponding code would need to be added for it to support the cooldown mechanism.
Sequence diagram
Sequence diagram for the whole pipeline - Service Log integration
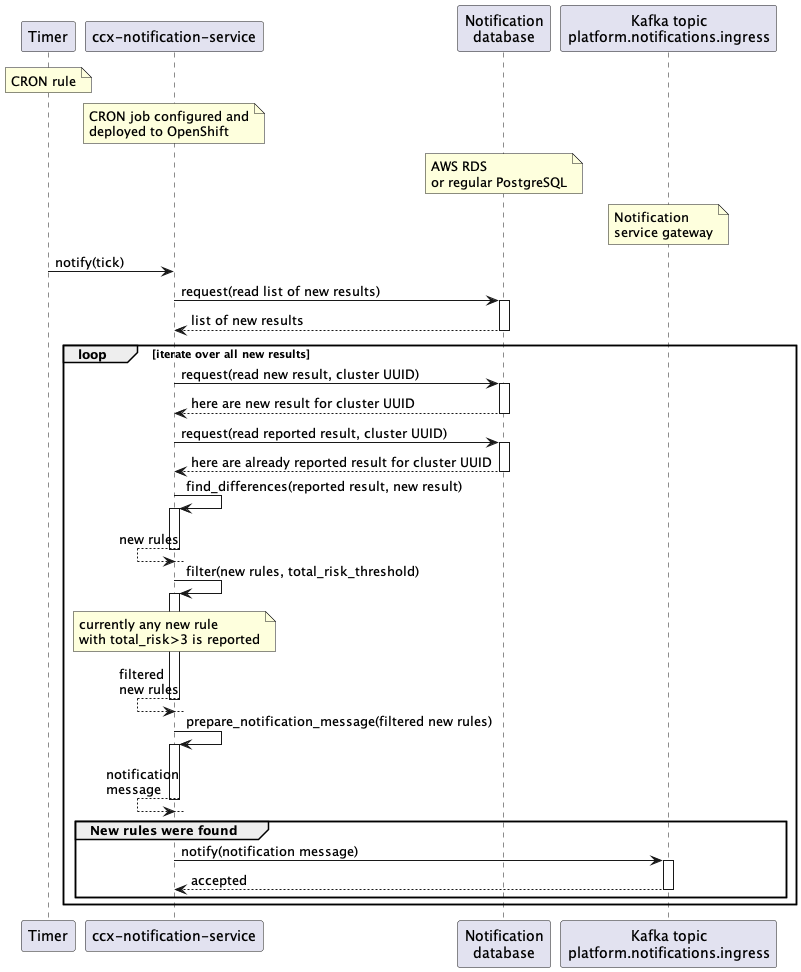
Sequence diagram for instant reports
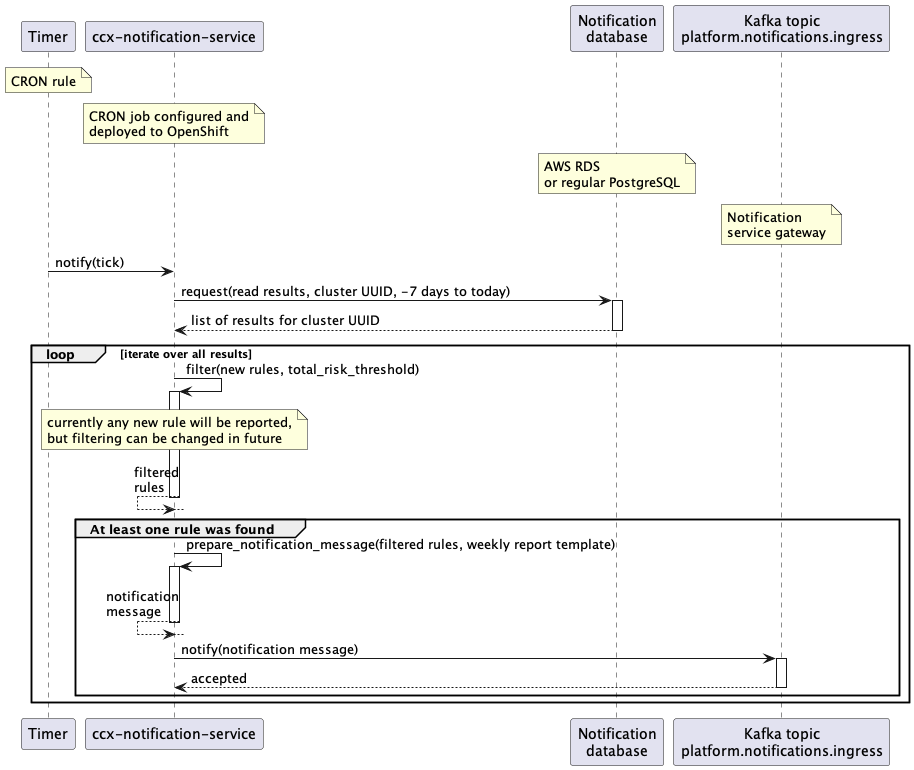
Sequence diagram for weekly reports